报表设计时,不单单会简单的使用表格进行报表的设计,还会使用图表来进行丰富的可视化展示,如 柱形图、折线图、饼图、面积图、堆积图等等。下面我们就来一一解析下如何使用这些图表控件。
折线图
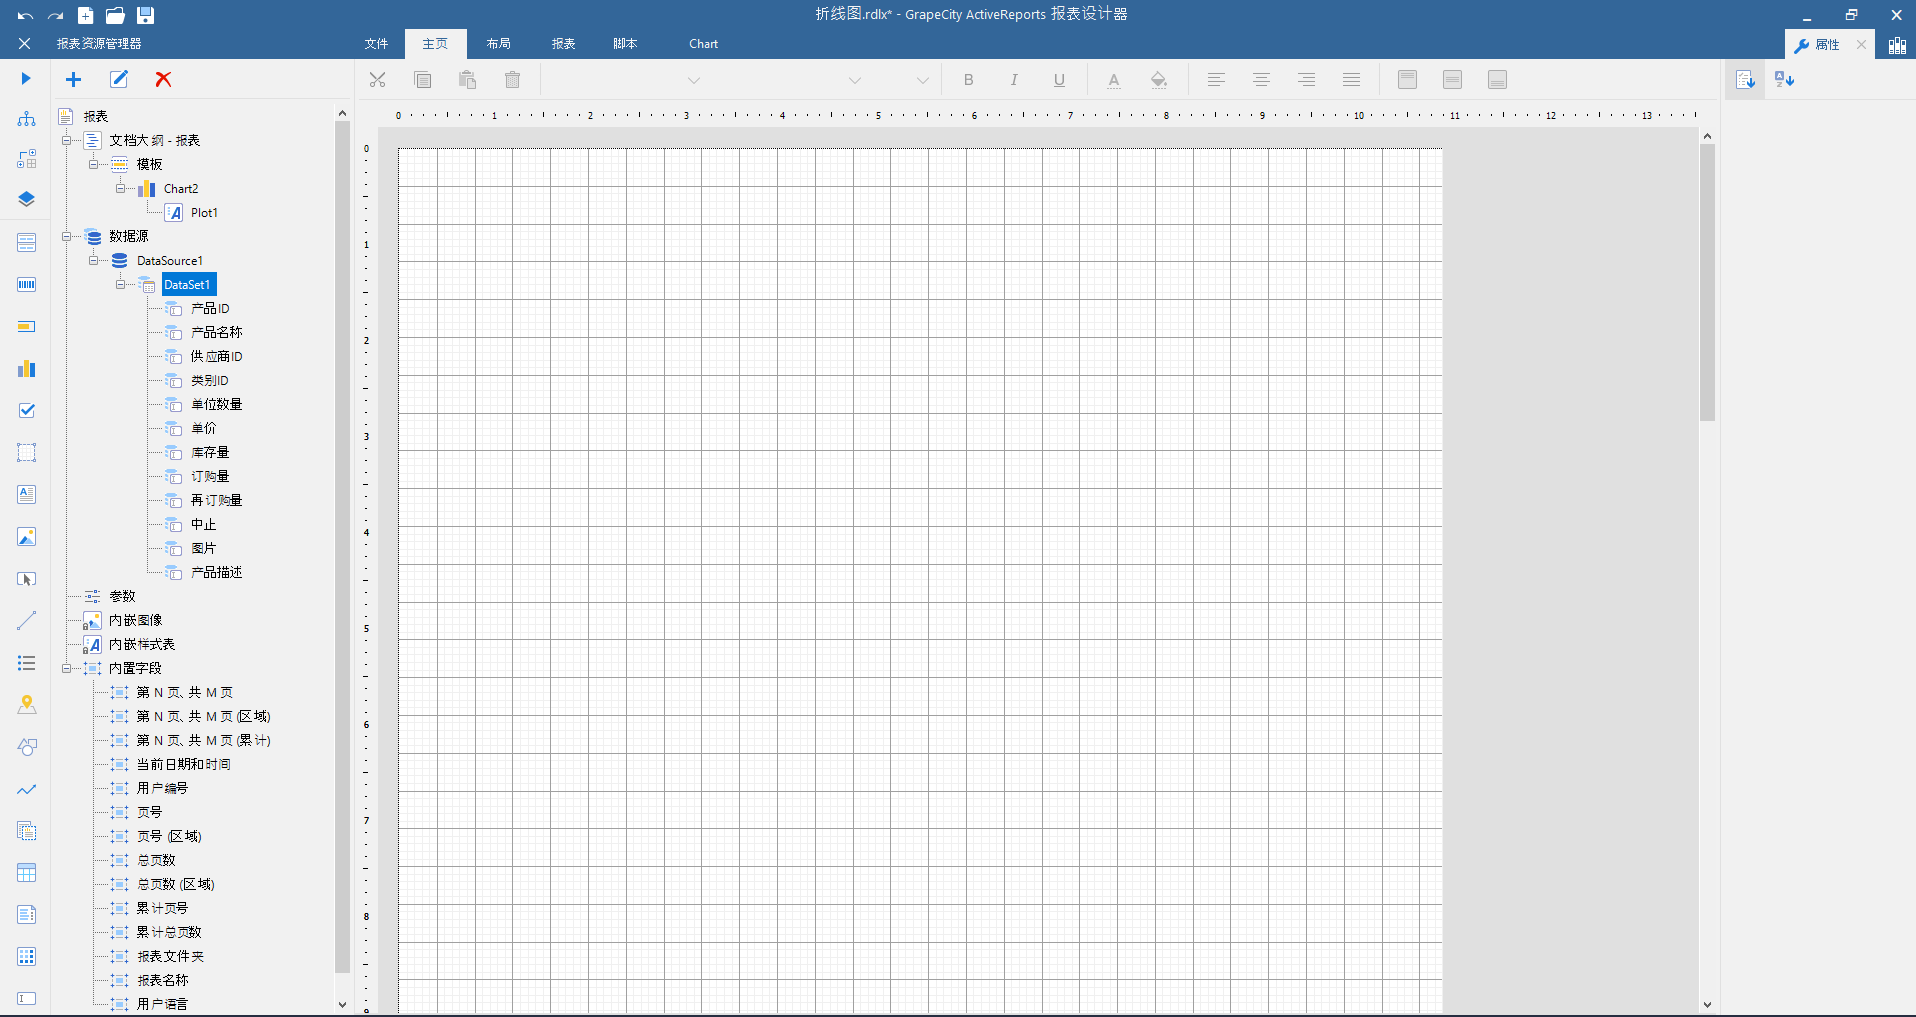
1.进行数据源和数据集的绑定
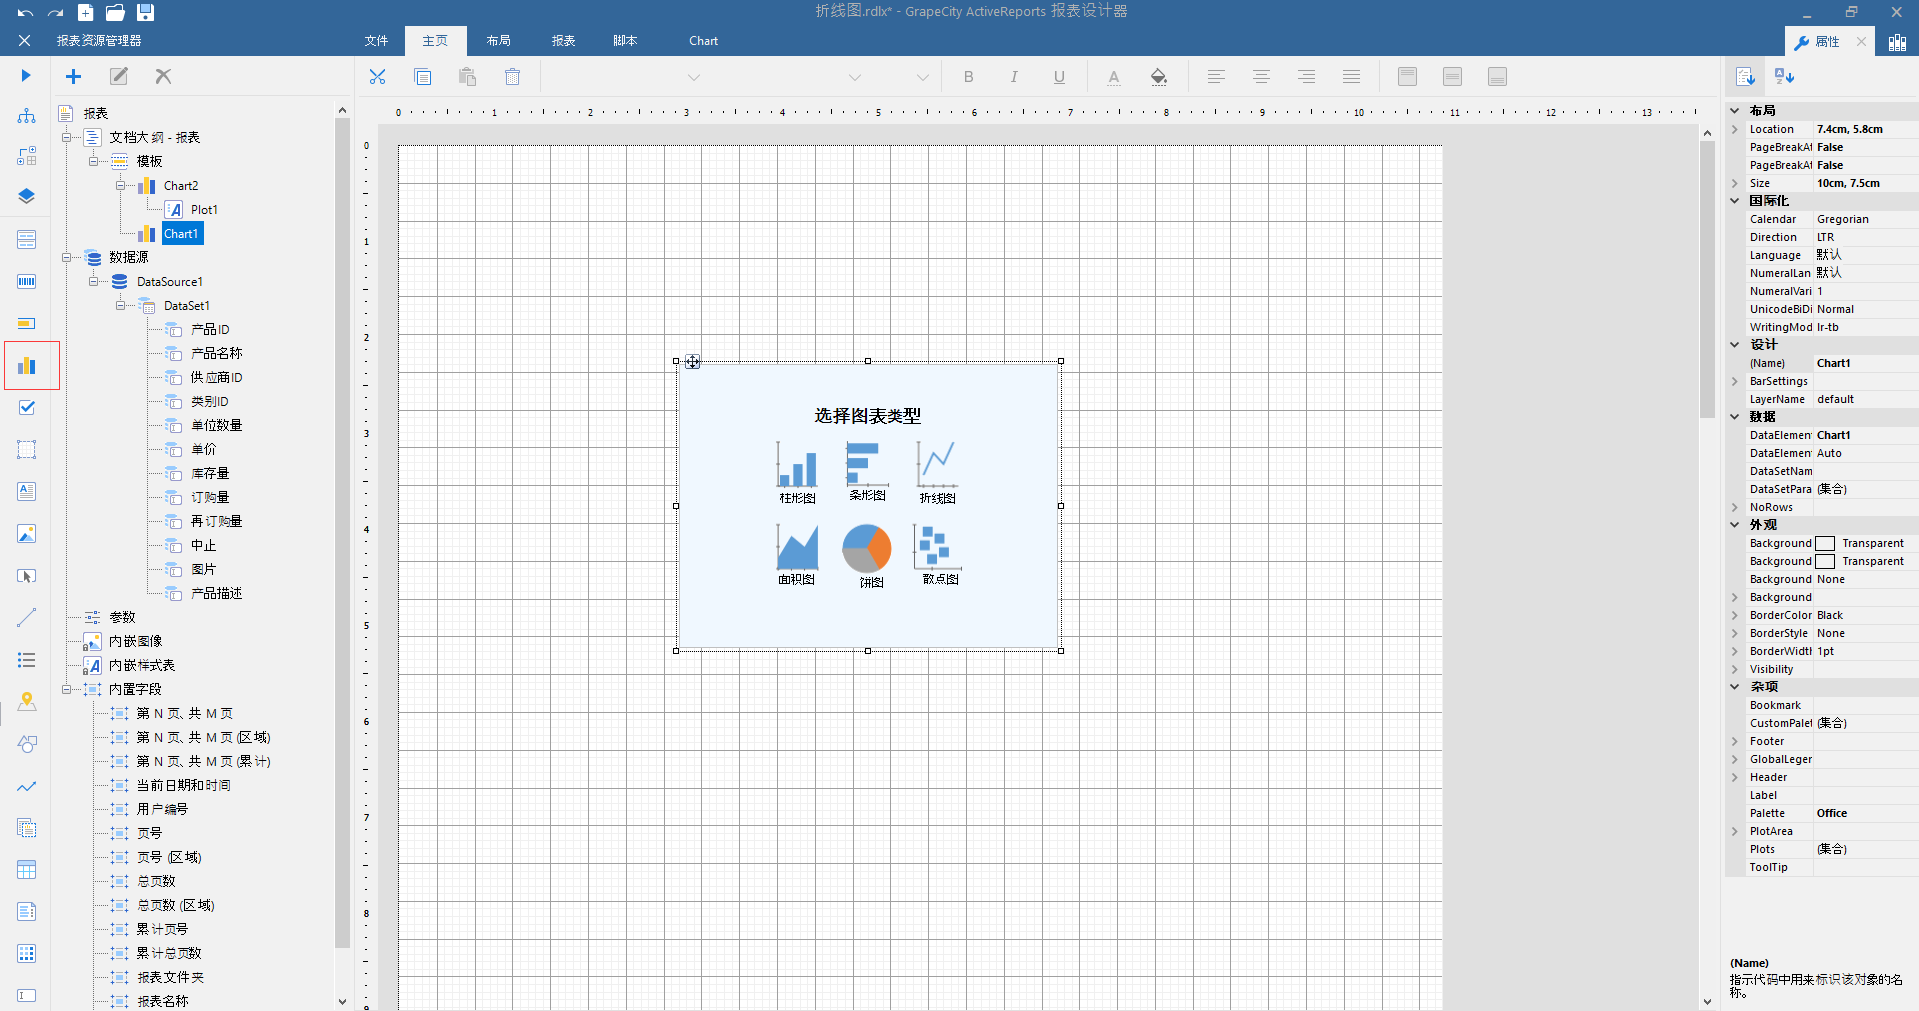
2.拖入图表控件,选择折线图
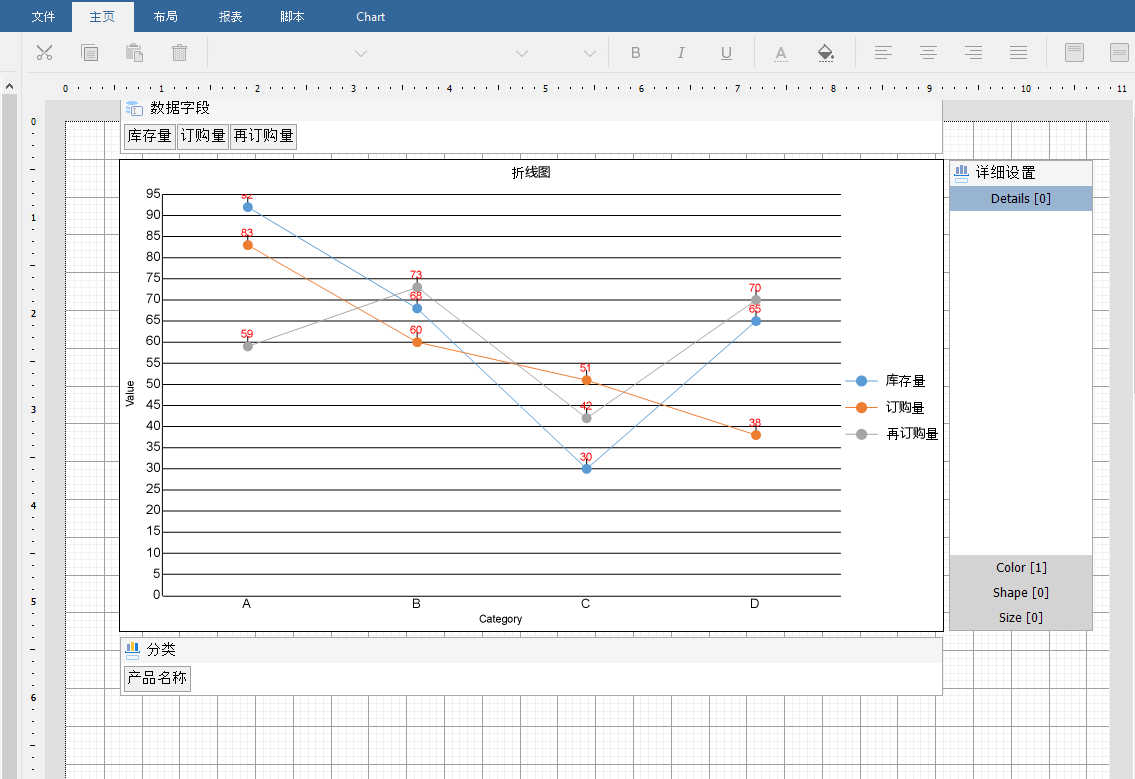
3.进行数据的绑定:
分类:产品名称, 数据字段:库总量、订购量、再订购量
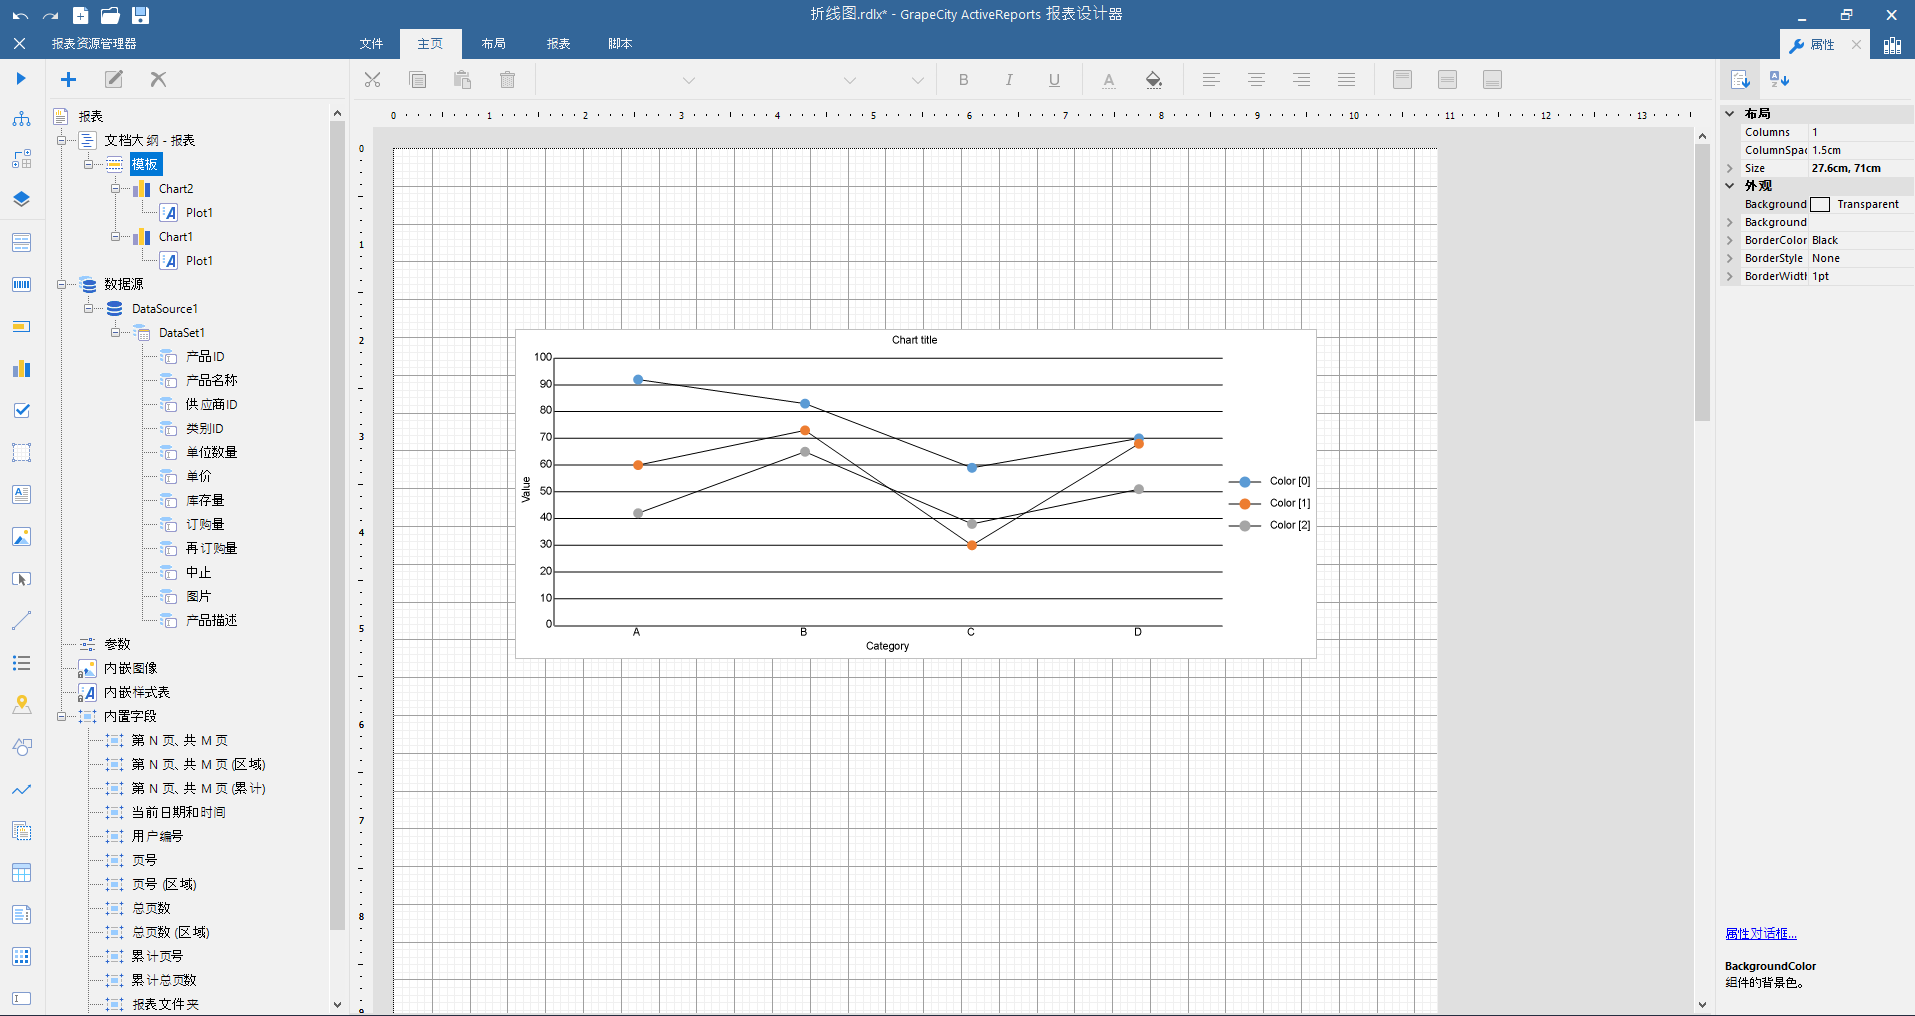
4、预览结果

相关资源:
注意
如需寻求在线帮助,请访问 ActiveReports 求助中心
如需了解更多ActiveReports产品特性,请访问 ActiveReports 官方网站
ActiveReports 官方技术交流群:109783140
下载产品体验产品功能:http://www.gcpowertools.com.cn/products/download.aspx?pid=16