数据绑定提供了一种在FlexChart和应用程序数据之间创建链接的方法。FlexChart允许您绑定来自数据库的数据以及存储在其他结构(如数组和集合)中的数据。本主题讨论了向图表提供数据的三种方法。
图表绑定
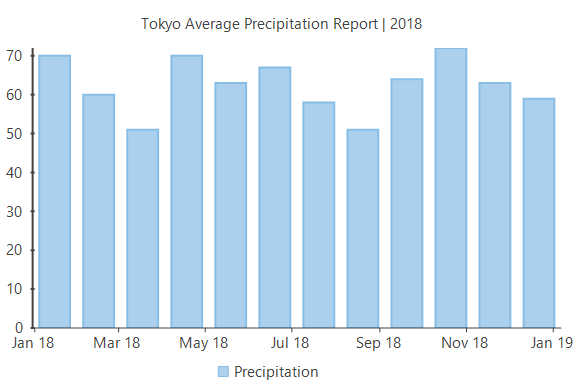
图表绑定是最简单的绑定形式,您只需通过设置FlexChart.DataSource属性来设置数据源 ,然后将FlexChart.Binding和 FlexChart.BindingX属性映射 到要在Y轴和X上绘制的字段-图表的轴。
CS
//Clearing default Series present in chart
this.flexChart1.Series.Clear();

//Passing data to FlexChart
this.flexChart1.DataSource = GetTemperatureData("Tokyo", 360).First().Data;

//Setting FlexChart's Header and styling it
this.flexChart1.Header.Content = "Tokyo Average Precipitation Report | 2018";

//Binding chart's AxisX to 'Date'
this.flexChart1.BindingX = "Date";

//Adding a Series to chart and binding it's (AxisY) to 'Temperature' field of Data
this.flexChart1.Series.Add(new Series
{
    //Name property specifies the string to be displayed corresponding to this Series in Legend
    Name = "Precipitation",
    Binding = "Precipitation"
});
请注意,上面的示例代码使用名为GetTemperatureData的自定义方法来提供数据。您可以根据需要设置数据源。
CS
static Random rnd = new Random();
/// <summary>
/// Method creating 'Temperature' data
/// </summary>
 //Create data source for chart binding
public static List<CityDataItem> GetTemperatureData(string city, int count = 360)
{
    var data = new List<CityDataItem>();
    var startDate = new DateTime(2018, 1, 15);
    var dataItem = new CityDataItem() { Name = city };
    for (int i = 0; i < count;)
    {
        var temp = new Temperature();
        DateTime date = startDate.AddDays(i);
        temp.Date = date;
        temp.Precipitation = (date.Month > 6 && date.Day < 20) ? rnd.Next(45, 80) : rnd.Next(50, 75);
        dataItem.Data.Add(temp);
        i += 31;
    }
    data.Add(dataItem);
    return data;
}
轴绑定
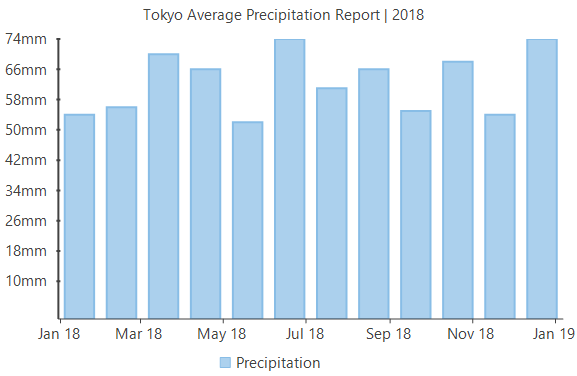
轴绑定是指将轴与单独的数据源绑定,以呈现与将图表与图表数据源绑定时显示的轴标签不同的轴标签。例如,在上面的示例中,我们可以覆盖与图表数据源绑定时自动呈现的Y轴标签,以毫米为单位显示降水值。FlexChart提供 Axis.Datasource和Axis.Binding属性,以便您可以将轴绑定到另一个数据源。
CS
//Passing data to FlexChart's AxisY
this.flexChart1.AxisY.DataSource = GetAxisBindinglabels();

//Setting which fields to bind to AxisY
this.flexChart1.AxisY.Binding = "Value,Text";
请注意,上面的示例代码使用名为GetAxisBindinglabels的自定义方法来提供数据。您可以根据需要设置数据源。
CS
//Create data source for axis binding
public static List<object> GetAxisBindinglabels()
{
    var data = new List<object>();
    for (double i = 10; i < 250; i += 8)
    {
        data.Add(new { Value = i, Text = i / 100 >= 10 ? string.Format("{0} mm", i / 1000) : string.Format("{0}mm", i) });
    }
    return data;
}
系列绑定
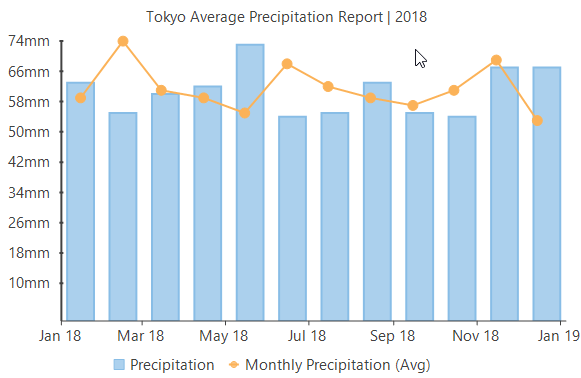
在系列绑定中,可以将特定系列绑定到单独的数据源,并显示原始数据源中不存在的数据。例如,在以上两个部分的示例中,我们可以进一步添加另一个系列,以在同一图表中显示来自不同数据源的平均月降水量。
CS
//Create data for AxisX
var monthlyData = GetTemperatureData("Tokyo", 360).First().Data.GroupBy(x => x.Date.Month).SelectMany(grp => grp.Select(val => new
{
    Date = new DateTime(val.Date.Year, grp.Key, 15),
    Value = grp.Average(x => x.Precipitation),
})).Distinct().ToList();

this.flexChart1.Series.Add(new Series
{
    Name = "Monthly Precipitation (Avg)",
    Binding = "Value",
    ChartType = ChartType.LineSymbols,
    DataSource = monthlyData,
});