<style>
#temp-video-cover {
display: none;
position: fixed;
top: 0;
bottom: 0;
right: 0;
left: 0;
z-index: 11;
background-color: rgba(0, 0, 0, 0.3);
transition: .15s;
opacity: 0;
font-family: "微软雅黑", "PingFangSC", "Helvetica neue", "Hiragino sans gb", "Arial", "Microsoft YaHei UI", "Microsoft YaHei", "SimSun", "sans-serif";
user-select: none;
-ms-user-select: none;
}
#temp-video-container {
position: absolute;
top: 50%;
left: 50%;
transform: translate(-50%, -50%);
z-index: 1;
}
#temp-video-title {
position: absolute;
opacity: 0;
right: 10px;
top: 0px;
transition: .15s;
}
#temp-video-container:hover #temp-video-title {
display: inline;
opacity: 1;
top: 10px;
}
.FUI-dialog-header {
position: relative;
display: flex;
align-items: center;
padding: 0.5rem 0.8rem 0.5rem 1rem;
background-color: rgb(0, 135, 205);
border-color: rgb(0, 135, 205);
}
.FUI-dialog-header-title {
font-size: 1rem;
word-break: keep-all;
text-overflow: ellipsis;
overflow: hidden;
white-space: nowrap;
flex-grow: 1;
color: white;
}
.FUI-dialog-header-close {
width: 1.25rem;
height: 1.25rem;
font-size: 0.8rem;
line-height: 1.25rem;
border-radius: 0.9rem;
color: #0088CE;
text-align: center;
transition: background-color 0.5s;
cursor: pointer;
background-color: #2FB8FF;
}
.FUI-dialog-header-close:hover {
cursor: pointer;
background-color: #6ACCFF;
}
.FUI-dialog-content {
position: relative;
flex-grow: 1;
background-color: rgb(0, 135, 205);
font-size: 0;
}
.FUI-dialog-footer {
position: relative;
height: 3rem;
min-height: 3rem;
display: flex;
flex-direction: row-reverse;
align-items: center;
padding: 0.5rem;
background-color: #F0F0F0;
}
.FUI-button-svg {
display: inline-block;
}
#speed-box {
background-color: #070707;
border-color: #070707;
color: #8B8B8B;
display: flex;
justify-content: flex-end;
height: 2rem;
align-items: center;
font-weight: 200;
}
.speed-box-header {
font-size: 0.9rem;
cursor: default;
}
.speed-box-content {
display: flex;
font-size: 0.7rem;
}
.speed-box-content>div {
width: 2.7rem;
height: 1.2rem;
background-color: #373737;
margin: 0 0.5rem;
text-align: center;
line-height: 1.2rem;
border-radius: 0.6rem;
cursor: pointer;
}
.speed-box-content>div:hover {
background-color: #555555;
color: #FFFFFF;
}
.speed-box-content .speed-box-selected {
background-color: #767676;
color: #FFFFFF;
}
.speed-box-content .speed-box-selected:hover {
background-color: #767676;
}
</style>
<div style="text-align:right;">
<a title="观看本节视频" href="javascript:showVideo();" style="text-decoration:none;">
<img src="https://help.grapecity.com.cn/download/attachments/46173032/VideoPortal.png?api=v2" />
</a>
</div>
<div id="temp-video-cover">
<div id="temp-video-container">
<div class="FUI-dialog-header">
<span class="FUI-dialog-header-title">活字格视频</span>
<div class="FUI-dialog-header-close" id="FUI-dialog-close" title="" onclick="closeVideo()">
<span class="FUI-button-svg"></span><span class="FUI-button-text">✕</span></div>
</div>
<div class="FUI-dialog-content">
<div style="overflow:hidden;">
<video id="temp-video" src="http://video1.grapecity.com.cn/HuoZiGe/Tutorials/v5.0/教学视频/图表-柱形图.mp4"
height="450" controls="controls" onplaying="startplay()">您的浏览器不支持播放此视频。</video>
</div>
</div>
<div id="speed-box">
<div class="speed-box-header">
<div>倍速:</div>
</div>
<div class="speed-box-content">
<div>0.5X</div>
<div class="speed-box-selected">1.0X</div>
<div>1.25X</div>
<div>1.5X</div>
<div>2.0X</div>
</div>
</div>
</div>
</div>
<script>
var videoContainer = document.getElementById("temp-video-container");
var videoCover = document.getElementById("temp-video-cover");
var video = document.getElementById("temp-video");
function showVideo() {
videoCover.style.display = "block";
setTimeout(function () {
videoCover.style.opacity = 1;
video.play();
}, 200);
}
function closeVideo() {
videoCover.style.opacity = 0;
setTimeout(function () {
videoCover.style.display = "none";
video.pause();
}, 150);
return false;
}
function setPlaySpeed(item) {
video.playbackRate = parseFloat(item.textContent);
document.getElementsByClassName("speed-box-selected")[0].classList.remove("speed-box-selected");
item.classList.add("speed-box-selected");
}
var isplayed = 1;
var startplay = function () {
if (isplayed) {
ga('send', 'event', 'Play Video', '活字格');
isplayed = 0;
}
return false;
}
videoCover.onclick = function (e) {
if (e.target.nodeName === "A") {
closeVideo();
}
}
document.querySelectorAll("#speed-box .speed-box-content>div").forEach((item) => {
item.addEventListener('click', () => { setPlaySpeed(item) });
});
</script>
|
 1.描述
1.描述
柱形图是一种以长方形的长度为变量的统计图表。柱形图用来比较两个或以上的价值(不同时间或者不同条件),只有一个变量,通常利用于较小的数据集分析。
柱形图是最常见的图表类型,本节介绍活字格中的柱形图。
 2.插入柱形图
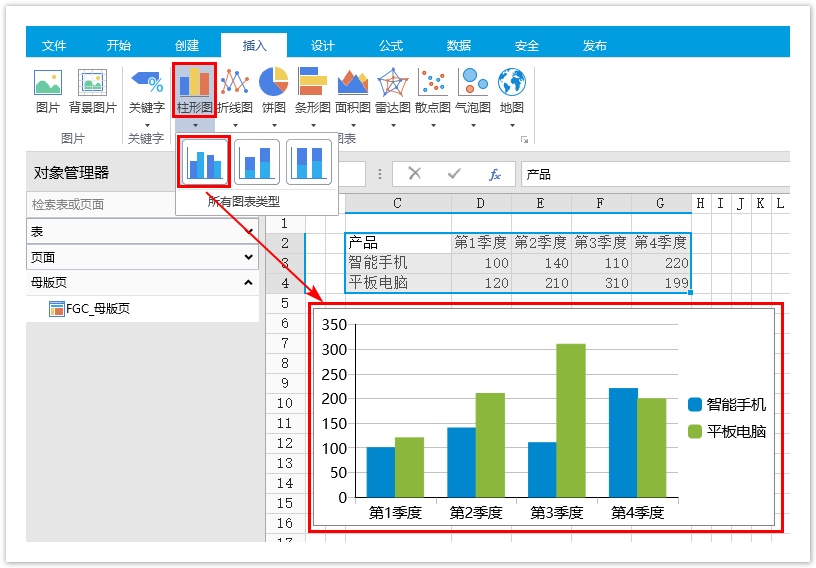
选择单元格区域或表格作为数据源,在功能区菜单栏中单击“插入”,选择柱形图中的一种,单击即可插入柱形图。
具体操作可参见基本使用。
图1 插入柱形图
 3.子图表类型
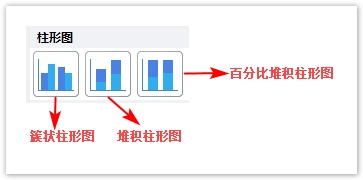
柱形图包括三个子图表类型:簇状柱形图、堆积柱形图和百分比堆积柱形图。
图2 子图表类型
簇状柱形图
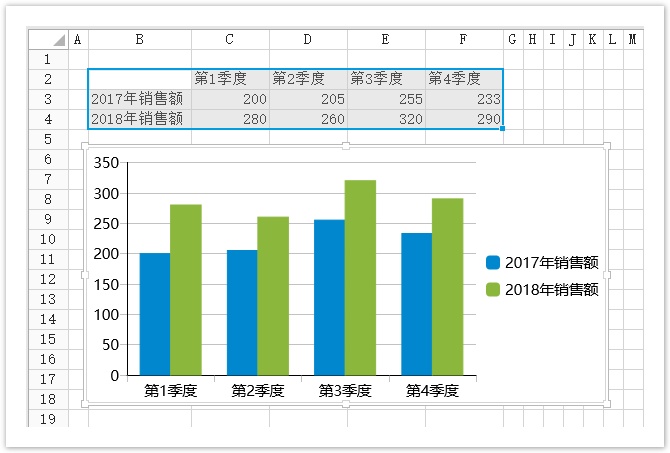
可以直观的展示数据的差值大小。一般按照对比维度字段切分并列生长,采用不同的颜色来反映对比维度间的关系。
如下的状柱形图显示了2017和2018两个年度中各个季度销售量的对比。
图3 簇状柱形图
堆积柱形图
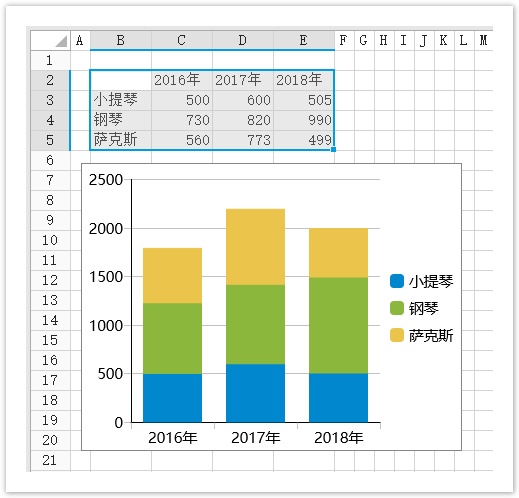
每一根柱子上的值分别代表不同的数据大小,各层的数据总和代表整根柱子的高度。可以形象的展示一个大分类包含的每个小分类的数据,以及小分类的占比情况,显示的是单个项目与整体之间的关系。
堆积柱形图的一个缺点是,当柱子上的堆叠太多时会导致数据很难区分对比,同时很难对比不同分类下相同维度的数据,因为他们不是按照同一基准线对齐的。
如下的堆积柱状图显示了2016、2017、2018年中三种乐器销售数量的占比情况。
图4 堆积柱形图
百分比堆积柱形图
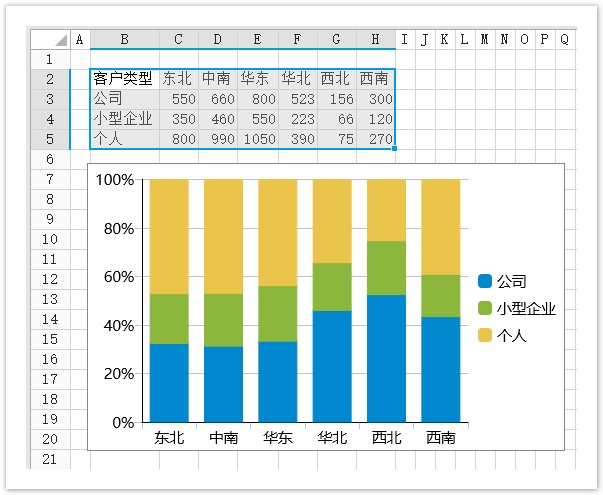
主要用于比较各个类别的每一数值所占总值的百分比。
如下的百分比堆积柱形图中展示了各地区按客户类型的销售额占比情况。
图5 百分比堆积柱形图
 4.使用建议
图表类型的选择
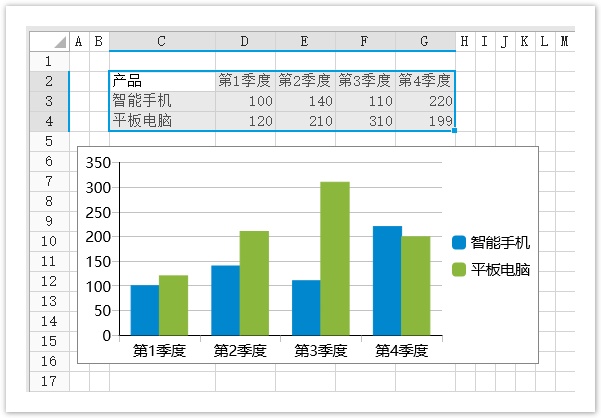
①分析分类数据字段或者连续的数据字段,利用柱子的高度来反映数据的数据差异,这时可以使用簇状柱形图。
如下图,为产品智能手机和平板电脑的各个季度的销售额,使用簇状柱形图,很容易的就能看出其差异。
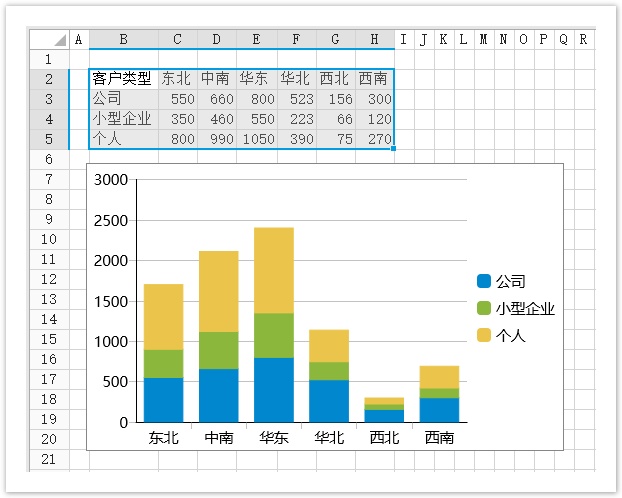
②分析大分类包含的小数据或小分类的占比情况时,使用堆积柱状图,可以直接的显示出单个项目和整体之间的关系。
如下图,使用堆积柱形图展示各地区按客户类型销售额占比情况。
不适合使用柱形图的情况
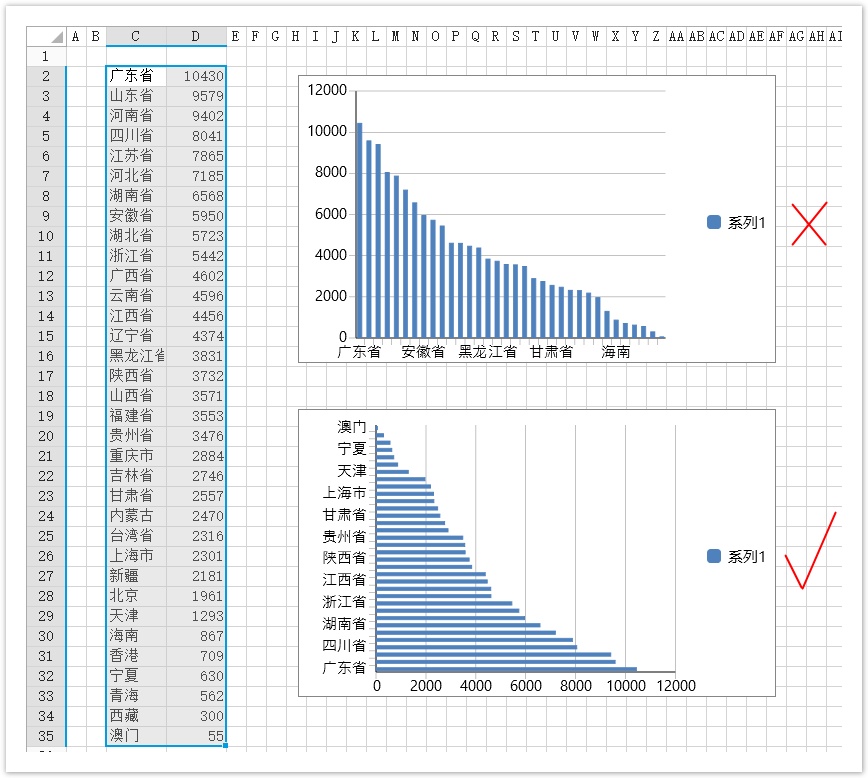
①维度项较多且名称较长时
当维度分类较多,且字段名称较长时,不适合使用柱形图,条形图更为合适。
条形图相比柱形图的优势在于能够横向布局,方便展示较长的维度项名称。
如下图中,对比不同省份的人口数量时,相对于柱形图,条形图更便于用户的阅读,适合于此类分类较多的场景。
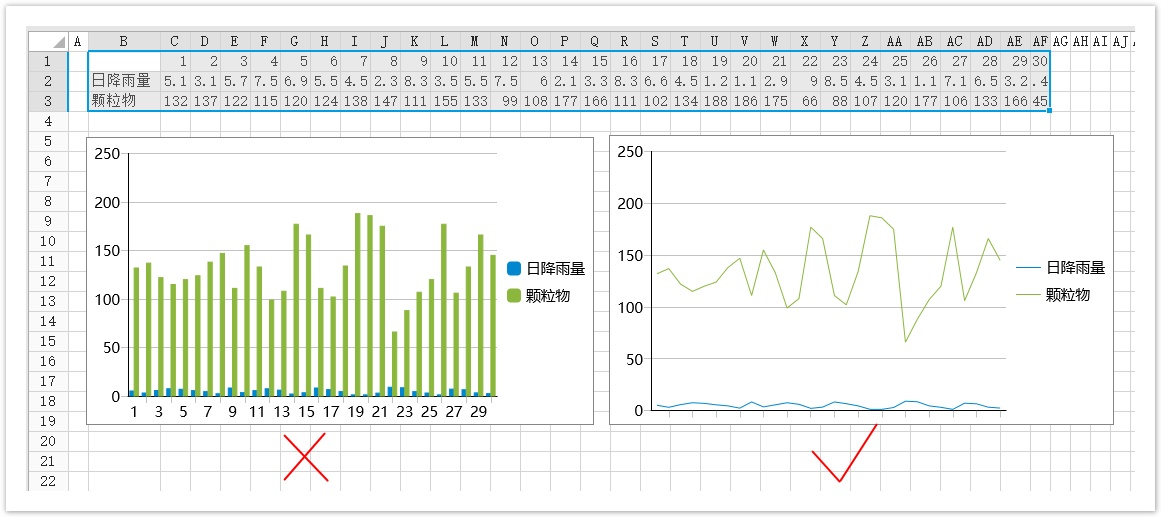
②表示很多个时间序列的数值趋势时
时间序列数据经常伴随多个数值的比较,如果使用柱形图,柱形图的面积会造成严重干扰,此时应选用折线图或面积图,视觉上会更直观。
③柱状图与折线图、饼图相比:
- 柱状图主要用于多个分类间的数据(大小或数值)的对比;
- 折线图主要用于展示连续数值(如时间)或者有序分类的变化趋势;
- 饼图主要用于展示分类之间的占比情况。
![]()