通过ParetoSparkline函数可以创建一个阶梯瀑布函数迷你图。
ParetoSparkline函数有以下参数:
Option | Description |
points | 表示所描述的数据区域,比如 "B2:B7"。 |
pointIndex | 类型为数字或者引用,表示某个数据点在所有数据点中的索引,而且这个索引大于等于1,比如 1 或者 "D2"。 |
colorRange | (可选参数)这个引用范围内的单元格中包含了所有盒子的颜色,比如 "D2:D7";默认值是空(null)。 |
target | (可选参数)类型为数字或者引用,表示"目标"线的位置,比如 0.5;默认值是空(null)。 |
target2 | (可选参数)类型为数字或者引用,表示"目标二"线的位置,比如 0.5;默认值是空(null)。 |
highlightPosition | (可选参数)类型为数字或者引用,表示哪个数据点对应的盒子应该被设置为红色,比如 3;默认值是空(null)。 |
label | (可选参数)类型为数字,表示这个数据点对应的标签应该显示成累积的百分比(label = 1),还是这个数据点单个的百分比(label = 2)或者不显示标签(label = 0),默认值是不显示。 |
vertical | (可选参数)类型为布尔值,表示这个盒子是垂直显示还是水平显示;默认值是false,也就是水平显示。 |
你可以通过阶梯瀑布函数创建一个阶梯瀑布函数迷你图,比如:
=PARETOSPARKLINE(points, pointIndex, colorRange, target, target2, highlightPosition, label, vertical)
下面代码展示了如何创建阶梯瀑布函数迷你图
activeSheet.addSpan(0, 0, 1, 3);
activeSheet.getCell(0, 0, GC.Spread.Sheets.SheetArea.viewport).value("Reason for Being Late").font("20px Arial").hAlign(GC.Spread.Sheets.HorizontalAlign.center).vAlign(GC.Spread.Sheets.VerticalAlign.center).backColor("purple").foreColor("white");
activeSheet.getRange(1, 2, 6, 1, GC.Spread.Sheets.SheetArea.viewport).setBorder(new GC.Spread.Sheets.LineBorder("transparent", GC.Spread.Sheets.LineStyle.thin),{ inside: true });
activeSheet.setValue(1, 0, "Traffic");
activeSheet.setValue(2, 0, "Child care");
activeSheet.setValue(3, 0, "Public transportation");
activeSheet.setValue(4, 0, "Weather");
activeSheet.setValue(5, 0, "Overslept");
activeSheet.setValue(6, 0, "Emergency");
activeSheet.setValue(7, 0, "target");
activeSheet.setValue(8, 0, "target2");
activeSheet.setValue(1, 1, 20);
activeSheet.setValue(2, 1, 15);
activeSheet.setValue(3, 1, 13);
activeSheet.setValue(4, 1, 5);
activeSheet.setValue(5, 1, 4);
activeSheet.setValue(6, 1, 1);
activeSheet.setValue(7, 1, 0.5);
activeSheet.setValue(8, 1, 0.8);
activeSheet.setValue(1, 2, "#FF1493");
activeSheet.setValue(2, 2, "#FFE7BA");
activeSheet.setValue(3, 2, "#FFD700");
activeSheet.setValue(4, 2, "#FFAEB9");
activeSheet.setValue(5, 2, "#FF8C69");
activeSheet.setValue(6, 2, "#FF83FA");
activeSheet.addSpan(7, 2, 2, 2);
activeSheet.getCell(7, 2, GC.Spread.Sheets.SheetArea.viewport).wordWrap(true);
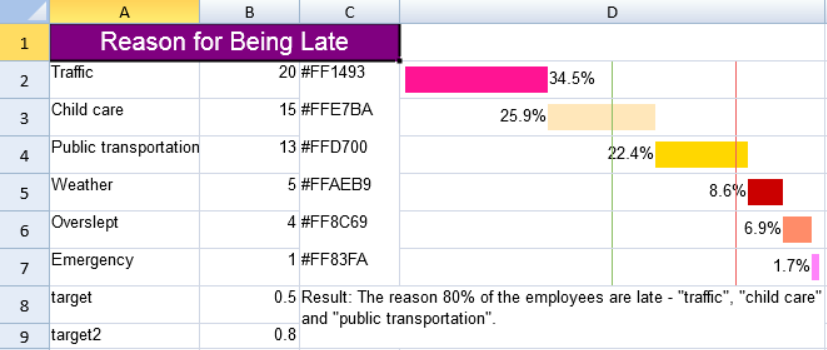
activeSheet.setValue(7, 2, 'Result: The reason 80% of the employees are late - "traffic", "child care" and "public transportation".');
activeSheet.setColumnWidth(0, 120);
activeSheet.setColumnWidth(1, 80);
activeSheet.setColumnWidth(2, 80);
activeSheet.setColumnWidth(3, 340);
activeSheet.setRowHeight(0, 30);
activeSheet.setRowHeight(1, 30);
activeSheet.setRowHeight(2, 30);
activeSheet.setRowHeight(3, 30);
activeSheet.setRowHeight(4, 30);
activeSheet.setRowHeight(5, 30);
activeSheet.setRowHeight(6, 30);
activeSheet.setRowHeight(7, 30);
activeSheet.setFormula(1, 3, '=PARETOSPARKLINE(B2:B7,1,C2:C7,B8,B9,4,2,false)');
activeSheet.setFormula(2, 3, '=PARETOSPARKLINE(B2:B7,2,C2:C7,B8,B9,4,2,false)');
activeSheet.setFormula(3, 3, '=PARETOSPARKLINE(B2:B7,3,C2:C7,B8,B9,4,2,false)');
activeSheet.setFormula(4, 3, '=PARETOSPARKLINE(B2:B7,4,C2:C7,B8,B9,4,2,false)');
activeSheet.setFormula(5, 3, '=PARETOSPARKLINE(B2:B7,5,C2:C7,B8,B9,4,2,false)');
activeSheet.setFormula(6, 3, '=PARETOSPARKLINE(B2:B7,6,C2:C7,B8,B9,4,2,false)');
See Also
Spread.Sheets Designer Insert and Design Tab
setFormula Method