通过折线图函数,柱形图函数,或者盈亏图函数可以创建各自的迷你图。
函数有以下参数:
Option | Description |
Data | 类型为引用,表示迷你图的所有数据,比如"A1:C3"。 |
DataOrientation | 类型为数字,表示迷你图所引用数据的方向。值为以下其中之一: vertical(竖向)- 0 |
DateAxisData | (可选参数)类型为引用,表示迷你图的时间轴数据,比如"D1:F3"。 |
DateAxisOrientation | (可选参数)类型为数字,表示迷你图轴的方向,值为以下其中之一: vertical(竖向)- 0 |
Setting | (可选参数)类型为JSON格式的字符串;内容保持与 GC.Spread.Sheets.Sparklines.SparklineSetting. 相同的定义 |
下表列出了JSON格式的字符串和对应的迷你图参数属性。
Json Property | SparklineSetting.Options Property |
AXISCOLOR | axisColor |
FIRSTMARKERCOLOR | firstMarkerColor |
HIGHMARKERCOLOR | highMarkerColor |
LASTMARKERCOLOR | lastMarkerColor |
LOWMARKERCOLOR | lowMarkerColor |
MARKERSCOLOR | markersColor |
NEGATIVECOLOR | negativeColor |
SERIESCOLOR | seriesColor |
DISPLAYEMPTYCELLSAS | displayEmptyCellsAs |
RIGHTTOLEFT | rightToLeft |
DISPLAYHIDDEN | displayHidden |
DISPLAYXAXIS | displayXAxis |
SHOWFIRST | showFirst |
SHOWHIGH | showHigh |
SHOWLAST | showLast |
SHOWLOW | showLow |
SHOWNEGATIVE | showNegative |
SHOWMARKERS | showMarkers |
MANUALMAX | manualMax |
MANUALMIN | manualMin |
MAXAXISTYPE | maxAxisType |
MINAXISTYPE | minAxisType |
LINEWEIGHT | lineWeight |
你可以通过折线图函数,柱形图函数,或者盈亏图函数来创建各自的迷你图。比如:
=LINESPARKLINE(data, dataOrientation, dateAxisData, dateAxisOrientation, setting) =COLUMNSPARKLINE(data, dataOrientation, dateAxisData, dateAxisOrientation, setting) =WINLOSSSPARKLINE(data, dataOrientation, dateAxisData, dateAxisOrientation, setting)
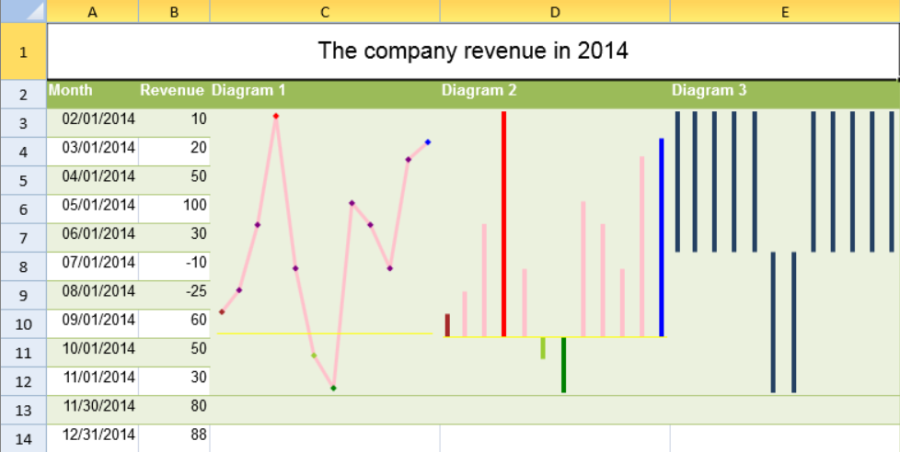
下面代码展示了如何创建折线迷你图,柱形图迷你图,盈亏图迷你图
activeSheet.addSpan(0, 0, 1, 5);
activeSheet.getCell(0, 0, GC.Spread.Sheets.SheetArea.viewport).value("The company revenue in 2014").font("20px Arial").hAlign(GC.Spread.Sheets.HorizontalAlign.center).vAlign(GC.Spread.Sheets.VerticalAlign.center);
var table1 = activeSheet.tables.add("table1", 1, 0, 13, 5, GC.Spread.Sheets.Tables.TableThemes.medium4);
table1.filterButtonVisible(false);
activeSheet.setValue(1, 0, "Month");
activeSheet.setValue(1, 1, "Revenue");
activeSheet.setValue(1, 2, "Diagram 1");
activeSheet.setValue(1, 3, "Diagram 2");
activeSheet.setValue(1, 4, "Diagram 3");
for (var i = 2; i < 14; i+) {
    activeSheet.setValue(i, 0, new Date(2014, i - 1, 1));
}
activeSheet.getRange(-1, 0, -1, 1).formatter("mm/dd/yyyy");
activeSheet.setValue(2, 1, 10);
activeSheet.setValue(3, 1, 20);
activeSheet.setValue(4, 1, 50);
activeSheet.setValue(5, 1, 100);
activeSheet.setValue(6, 1, 30);
activeSheet.setValue(7, 1, - 10);
activeSheet.setValue(8, 1, -25);
activeSheet.setValue(9, 1, 60);
activeSheet.setValue(10, 1, 50);
activeSheet.setValue(11, 1, 30);
activeSheet.setValue(12, 1, 80);
activeSheet.setValue(13, 1, 88);
activeSheet.addSpan(2, 2, 10, 1);
activeSheet.setFormula(2, 2, '=LINESPARKLINE(B3:B14,0,A3:A14,0,"{axisColor:rgb(255,255,0),firstMarkerColor:brown,highMarkerColor:red,lastMarkerColor:blue,lowMarkerColor:green,markersColor:purple,negativeColor:yellowgreen,seriesColor:pink,displayXAxis:true,showFirst:true,showHigh:true,showLast:true,showLow:true,showNegative:true,showMarkers:true,lineWeight:3,displayHidden:false,displayEmptyCellsAs:1,rightToLeft:false,minAxisType:1,maxAxisType:1,manualMax:5,manualMin:-3}")');activeSheet.addSpan(2, 3, 10, 1);
activeSheet.setFormula(2, 3, '=COLUMNSPARKLINE(B3:B14,0,A3:A14,0,"{axisColor:rgb(255,255,0),firstMarkerColor:brown,highMarkerColor:red,lastMarkerColor:blue,lowMarkerColor:green,markersColor:purple,negativeColor:yellowgreen,seriesColor:pink,displayXAxis:true,showFirst:true,showHigh:true,showLast:true,showLow:true,showNegative:true,showMarkers:true,lineWeight:3,displayHidden:false,displayEmptyCellsAs:1,rightToLeft:false,minAxisType:1,maxAxisType:1,manualMax:5,manualMin:-3}")');activeSheet.addSpan(2, 4, 10, 1);
activeSheet.setFormula(2, 4, '=WINLOSSSPARKLINE(B3:B14,0,A3:A14,0)');
activeSheet.setRowHeight(0, 50);for (var i = 1; i < 14; i+) {
    activeSheet.setRowHeight(i, 25);
}
activeSheet.setColumnWidth(0, 80);
activeSheet.setColumnWidth(2, 200);
activeSheet.setColumnWidth(3, 200);
activeSheet.setColumnWidth(4, 200);
See Also
setFormula Method