You can create a stacked sparkline using the StackedSparkline formula and cell values.
The stacked sparkline formula has the following options:通过StackedSparkline函数可以创建面积函数迷你图
StackedSparkline函数有以下这些参数:
Option | Description |
Points |
表示所描述的数据区域,比如"A1:A4" |
。 |
ColorRange |
(可选参数)类型为引用,所引用的单元格中包含了所有的颜色,比如"B1:B4" |
;默认值是由下面的color参数所代表的颜色生成的。 |
LabelRange |
(可选参数)类型为引用,所引用的单元格中包含了所有的标注,比如"C1:C4" |
Maximum
A number that represents the maximum value of the sparkline. This setting is optional. The default value is the summary of all positive values.
TargetRed
A number that represents the location of the red line. This setting is optional. The default value is empty.
TargetGreen
A number that represents the location of the green line. This setting is optional. The default value is empty.
TargetBlue
A number that represents the location of the blue line. This setting is optional. The default value is empty.
TargetYellow
A number that represents the location of the yellow line. This setting is optional. The default value is empty
Color
A string that represents the color if colorRange is omitted. This setting is optional. The default value is "#646464".
HighlightPosition
A number that represents the index of the highlight area. This setting is optional. The default value is empty.
Vertical
A boolean that represents whether to display the sparkline vertically. This setting is optional. The default value is false.
TextOrientation
A number that represents the label text orientation. This setting is optional. The default value is 0 (horizontal). The vertical setting is 1.
TextSize
A number that represents the size of the label text. This setting is optional. The default value is 10. The unit is px.
...
;默认值是空字符串。 | |
Maximum | (可选参数)类型为数字,表示迷你图的最大值;默认值是所有值为正的总和。 |
TargetRed | (可选参数)类型为数字,表示红线的位置;默认值是空字符串,也就是没有红线。 |
TargetGreen | (可选参数)类型为数字,表示绿线的位置;默认值是空字符串,也就是没有绿线。 |
TargetBlue | (可选参数)类型为数字,表示蓝线所在的位置;默认值是空字符串,也就是没有蓝线。 |
TargetYellow | (可选参数)类型为数字,表示黄线所在的位置;默认值是空字符串,也就是没有黄线。 |
Color | (可选参数)类型为颜色字符串,用来生成所有颜色的颜色字符串,如果colorRange省略的话,才会起作用;默认值是"#646464"。 |
HighlightPosition | (可选参数)类型为数字,表示应该高亮的是哪个区域;默认值是空字符串,也就是没有高亮区域。 |
Vertical | (可选参数)类型为布尔值,表示迷你图是垂直显示还是水平显示。默认值是false,也就是水平显示。 |
TextOrientation | (可选参数)类型为数字,表示标注文本的显示方向。可以是以下一种: 0: (默认值)水平显示 |
TextSize | (可选参数)类型为数字,表示标注文本的大小(以像素为单位);默认值是10。 |
你可以通过堆积函数创建一个堆积函数迷你图,比如:
=STACKEDSPARKLINE(points, colorRange?, labelRange?, maximum?, targetRed?, targetGreen?, targetBlue?, tragetYellow?, color?, highlightPosition?, vertical?, textOrientation?, textSize?) Using Code
下面代码展示了如何创建堆积函数迷你图 The following
| Code Block |
|---|
...
JavaScript
...
Copy Code
| ||||
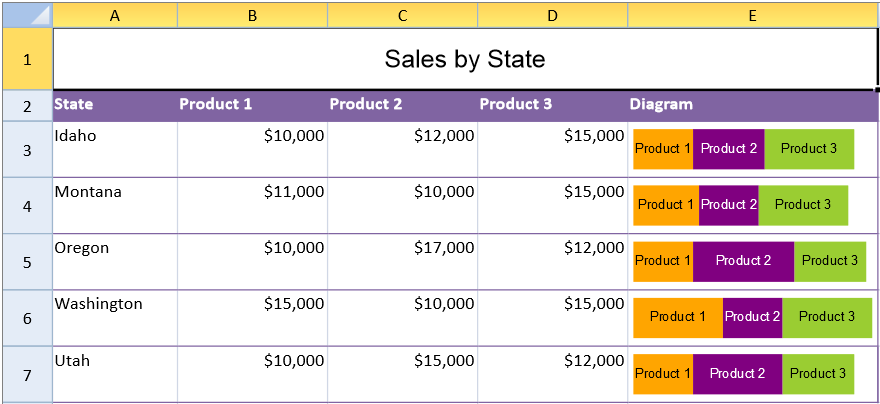
activeSheet.addSpan(0, 0, 1, 5); activeSheet.getCell(0, 0, GC.Spread.Sheets.SheetArea.viewport).value("Sales by State").font("20px Arial").hAlign(GC.Spread.Sheets.HorizontalAlign.center).vAlign(GC.Spread.Sheets.VerticalAlign.center); var table1 = activeSheet.tables.add("table1", 1, 0, 6, 5, GC.Spread.Sheets.Tables.TableThemes.light12); table1.filterButtonVisible(false); activeSheet.setValue(1, 0, "State"); activeSheet.setValue(1, 1, "Product 1"); activeSheet.setValue(1, 2, "Product 2"); activeSheet.setValue(1, 3, "Product 3"); activeSheet.setValue(1, 4, "Diagram"); activeSheet.setValue(2, 0, "Idaho"); activeSheet.setValue(2, 1, 10000); activeSheet.setValue(2, 2, 12000); activeSheet.setValue(2, 3, 15000); activeSheet.setValue(3, 0, "Montana"); activeSheet.setValue(3, 1, 11000); activeSheet.setValue(3, 2, 10000); activeSheet.setValue(3, 3, 15000); activeSheet.setValue(4, 0, "Oregon"); activeSheet.setValue(4, 1, 10000); activeSheet.setValue(4, 2, 17000); activeSheet.setValue(4, 3, 12000); activeSheet.setValue(5, 0, "Washington"); activeSheet.setValue(5, 1, 15000); activeSheet.setValue(5, 2, 10000); activeSheet.setValue(5, 3, 15000); activeSheet.setValue(6, 0, "Utah"); activeSheet.setValue(6, 1, 10000); activeSheet.setValue(6, 2, 15000); activeSheet.setValue(6, 3, 12000); activeSheet.setValue(7, 1, "orange"); activeSheet.setValue(7, 2, "purple"); activeSheet.setValue(7, 3, "yellowgreen"); activeSheet.getRange(-1, 1, -1, 1).formatter("$#,##0"); activeSheet.getRange(-1, 2, -1, 1).formatter("$#,##0"); activeSheet.getRange(-1, 3, -1, 1).formatter("$#,##0"); activeSheet.setFormula(2, 4, '=STACKEDSPARKLINE(B3:D3,B8:D8,B2:D2,40000)'); activeSheet.setFormula(3, 4, '=STACKEDSPARKLINE(B4:D4,B8:D8,B2:D2,40000)'); activeSheet.setFormula(4, 4, '=STACKEDSPARKLINE(B5:D5,B8:D8,B2:D2,40000)'); activeSheet.setFormula(5, 4, '=STACKEDSPARKLINE(B6:D6,B8:D8,B2:D2,40000)'); activeSheet.setFormula(6, 4, '=STACKEDSPARKLINE(B7:D7,B8:D8,B2:D2,40000)'); activeSheet.setRowHeight(0, 50); activeSheet.setRowHeight(1, 25); for (var i = 2; i < 7; i++) { |
...
activeSheet.setRowHeight(i, 45); } activeSheet.setRowHeight(7, 0); activeSheet.setColumnWidth(0, 100); activeSheet.setColumnWidth(1, 120); activeSheet.setColumnWidth(2, 120); activeSheet.setColumnWidth(3, 120); activeSheet.setColumnWidth(4, 200); |
...