You can create an hbar sparkline using the HBARSPARKLINE formula and cell values.
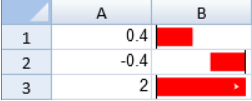
The sparkline starts at the left of the cell for positive values and right of the cell for negative values. If the value is greater than 100% or smaller than -100%, an arrow is displayed.
The hbar sparkline has the following options通过HBARSPARKLINE函数可以创建横向条状函数迷你图
如上图所示,在横向条状迷函数迷你图中:
正值,条状图会从单元格的左边开始;负值,条状图会从单元格的右边开始。
如果这个值大于100% 或者小于 -100%,将会出现一个箭头。
HBARSPARKLINE函数有以下参数:
Option | Description |
value |
A number or reference that represents the length of the bar. The value should be between 100% and -100%.
colorScheme
A string that represents the color of the bar. This setting is optional. The default value is "grey".
...
类型为数字或者引用,表示这个条的长度,比如 0.3 或者 "A1"。 | |
colorScheme | (可选参数)类型为颜色字符串,表示条的填充色的字符串;默认值是 "gray" |
你可以通过横向条状函数创建一个横向条状函数迷你图。比如:
=HBARSPARKLINE(value, colorScheme) Using Code
The following code creates hbar sparklines.
...
JavaScript
...
Copy Code
下面代码展示了如何创建横向条状函数迷你图
| Code Block | ||||
|---|---|---|---|---|
| ||||
activeSheet.setValue(0, 0, .4); activeSheet.setValue(1, 0, -.4); activeSheet.setValue(2, 0, 2); activeSheet.setFormula(0, 1, '=HBARSPARKLINE(A1,"red")'); activeSheet.setFormula(1, 1, '=HBARSPARKLINE(A2,"red")'); activeSheet.setFormula(2, 1, '=HBARSPARKLINE(A3,"red")'); activeSheet.setColumnWidth(0, 80); activeSheet.setColumnWidth(1, 80); |
...
See Also
setFormula Method