You can create a scatter sparkline using the ScatterSparkline formula and cell values.
The scatter sparkline formula has the following options:通过ScatterSparkline函数可以创建散点函数迷你图
ScatterSparkline函数有以下这些参数:
Option | Description |
Points1 |
The first xy data series. If the row count is greater than or equal to the column count, use data from the first two columns. The first column contains x-values and the second column contains y-values. If the row count is less than the column count, use data from the first two rows. The first row contains x-values and the second row contains y-values.
Points2
The second xy data series. If the row count is greater than or equal to the column count, use data from the first two columns. The first column contains x-values and the second column contains y-values. If the row count is less than the column count, use data from the first two rows. The first row contains x-values and the second row contains y-values.
MinX
The x-minimum limit of both series, each series has its own value if it is omitted.
MaxX
The x-maximum limit of both series, each series has its own value if it is omitted.
MinY
The y-minimum limit of both series, each series has its own value if it is omitted.
MaxY
The y-maximum limit of both series, each series has its own value if it is omitted.
HLine
The horizontal axis position, there is no line if it is omitted.
VLine
The vertical axis position, there is no line if it is omitted.
XMinZone
The x-minimum value of the gray zone, there is no grey zone if any of these four parameters are omitted.
XMaxZone
The x-maximum value of the gray zone, there is no grey zone if any of these four parameters are omitted.
YMinZone
The y-minimum value of the gray zone, there is no grey zone if any of these four parameters are omitted.
YMaxZone
The y-maximum value of the gray zone, there is no grey zone if any of these four parameters are omitted.
Tags
If this option is true, mark the point at which the y-value is the maximum of the first series as "#0000FF", and mark the point at which the y-value is the minimum of the first series as "#CB0000". This option is false if it is omitted.
DrawSymbol
If this option is true, draw each point as a symbol. The symbol of the first series is a circle, and the symbol of the second series is a square. This option is true if it is omitted.
DrawLines
If this option is true, connect each point with a line by sequence in each series. This option is false if it is omitted.
Color1
The color string of the first point series. The value is "#969696" if it is omitted.
Color2
The color string of the second point series. The value is "#CB0000" if it is omitted.
Dash
If this option is true, the line is a dashed line; otherwise, the line is a full line. This option is false if it is omitted.
...
第一个系列的 x,y的数据。它是一片范围,比如"H1:I3"。如果行数大于等于列数,那么从前两列获取数据;第一列包含了x的值,第二列包含了y的值。否则从前两行取数据;第一行包含x的值,第二行包含y的值。 | |
Points2 | (可选参数)第二个系列的x,y的数据。它是一片范围,比如"H4:I6"。如果行数大于等于列数,从前两列获取数据;第一列包含了x的值,第二列包含了y的值。否则从前两行获取数据;第一行包含了x的值,第二行包含了y的值。 |
MinX | (可选参数)两个系列x轴值的最小限制;如果这个值省略了,那么每一个系列就拥有自己的最小限制值。 |
MaxX | (可选参数)两个系列x轴值的最大限制;如果这个值省略了,那么每一个系列就拥有自己的最大限制值 |
MinY | (可选参数)两个系列y轴值得最小限制;如果这个值省略了,那么每一个系列就拥有自己的最小限制值。 |
MaxY | (可选参数)两个系列y轴值得最大限制;如果这个值省略了,那么每一个系列就拥有自己的最大限制值。 |
HLine | (可选参数)横轴的位置;如果这个值省略了,就没有水平轴。 |
VLine | (可选参数)纵轴的位置;如果这个值省略了,就没有纵轴。 |
XMinZone | (可选参数)x轴灰色区域的最小值;如果四个区域的参数都省略了,那么就没有灰色区域。 |
XMaxZone | (可选参数)x轴灰色区域的最大值;如果四个区域的参数都省略了,那么就没有灰色区域。 |
YMinZone | (可选参数)y轴灰色区域的最小值;如果四个区域的参数都省略了,那么就没有灰色区域。 |
YMaxZone | (可选参数)y轴灰色区域的最大值;如果四个区域的参数都省略了,那么就没有灰色区域。 |
Tags | (可选参数)如果为 true,将第一个系列中y轴值最大的标为"#0000FF",把第一个系列中y轴值最小的标为"#CB0000"。这个默认值是 false。 |
DrawSymbol | (可选参数)如果为 true ,将每一个点绘制成一个符号,第一个系列的这个符号是圆圈,第二个系列的这个符号是正方形。默认值是 true 。 |
DrawLines | (可选参数)如果为 true ,按顺序将每个系列的点用线连接起来。默认值是 false。 |
Color1 | (可选参数)表示第一个系列的点的颜色;默认值是"#969696"。 |
Color2 | (可选参数)表示第二个系列的点的颜色;默认值是"#CB0000"。 |
Dash | (可选参数)如果为 true ,连接线就是虚线;否则线是实线。默认值是 false。 |
你可以通过散点函数创建一个散点函数迷你图,比如:
=SCATTERSPARKLINE(points1, points2, minX, maxX, minY, maxY, hLine, vLine, xMinZone, xMaxZone, yMinZone, yMaxZone, tags, drawSymbol, drawLines, color1, color2, dash) Using Code
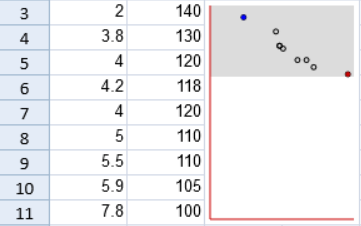
This example creates a scatter sparkline.
...
JavaScript
...
Copy Code
下面代码展示了如何创建散点函数迷你图
| Code Block | ||||
|---|---|---|---|---|
| ||||
activeSheet.setValue(2, 0, 2.0); activeSheet.setValue(2, 1, 140); activeSheet.setValue(3, 0, 3.8); activeSheet.setValue(3, 1, 130); activeSheet.setValue(4, 0, 4.0); activeSheet.setValue(4, 1, 120); activeSheet.setValue(5, 0, 4.2); activeSheet.setValue(5, 1, 118); activeSheet.setValue(6, 0, 4.0); activeSheet.setValue(6, 1, 120); activeSheet.setValue(7, 0, 5.0); activeSheet.setValue(7, 1, 110); activeSheet.setValue(8, 0, 5.5); activeSheet.setValue(8, 1, 110); activeSheet.setValue(9, 0, 5.9); activeSheet.setValue(9, 1, 105); activeSheet.setValue(10, 0, 7.8); activeSheet.setValue(10, 1, 100); activeSheet.addSpan(2, 2, 9, 2); activeSheet.setFormula(2, 2, '=SCATTERSPARKLINE(A3:B11,,0,8,0,150,0,0,0,8,100,150,TRUE,TRUE,FALSE,"FD8E2C")'); activeSheet.setRowHeight(0, 50); |
...
See Also
setFormula Method